1. The Global Counters
The Palo Alto Firewall has released an API, that has some (not all) commands to issue through external programmable interface.
This API is based on XML and makes it possible to issue specific commands with that you can check just for example some states of the firewall.
Through the API it possible to change the settings on the actual configuration or to check the actual state of its complicated processing.
The official documentation for the Version 6 can be found here:
PAN-OS and Panorama XML API Reference Guide 6.0
The main reason I would suggest to use it to check the operational states of the firewall that cant be monitored with standard snmp and realise it in time if something changes in the wrong direction or if something not expected happens.
It can be reached definetly with other ways too, like with alarms defined in your Security information and event management (SIEM) that collects every logs from the firewall and all network devices, but you may want to see more in a daily life of your security box instead of
– generating log for every events
– sending log for every events
– and centraly collecting logs
– and analysing millions of logs with a strong multicore computer.
Good news is that there are counters for almost every step of the packet/session/application processing in a Palo Alto firewall, like in Cisco ASA. In Cisco Firewall it is called ASP (Accelerated Security Path) and in Palo Alto it is called just global counter.
The bad news is that these counters are nowhere correctly documented and for a lot of them it is hard to find out the meaning of the numbers that just growing and growing.
With the known, documented counters you can identify many issues that maybe caused by wrong network configuration or wrong setup of clients, devices or by real malicious traffic.
This counters in an Application Firewall can inform you about an internal “problem” in the firewall too, that you would realise only if the first users call you.
For example after a software upgrade or some database update – like URL category database update or antivirus database update or IPS signature database update or update for heuristical checks – you may see that one or more drop or error counters for IPS, APP FW, Antivirus engine starts to increase.
If any from them, I mean the error or drop counters start to increase rapidly you can catch the problem easily, you dont have to collect tousand of logs for that, just check the counters for continuous high delta values.
Lets take an example. If an antivirus engine drop or error values increase in some minutes from 100 to 2000 than you can catch this anomaly just in time and start investigate the issue rapidly.
The problem is with this counter in Palo Alto Firewall that it is too much to monitor. The number of the counters in the current version (6) is about 1200 counters :-). But you should only keep your eyes on those counters that are created for the features you currently use.
For example if you dont have IPSec VPN or SSL VPN or SSL Interception then you can ignore the counters for those processes.
But if you use DoS Protection, that can be monitored too, you can catch it how your drops starts to increase and you can react in time. You can then start maybe just the fine-tunning of your DOS Protection feature or start analyse the sources that trigger the DoS.
I tried to identify which counter to which part of the packet processing belongs. It is currently not ready and needs a lot work but I attach it to the Post:
pa_counter_table
The monitoring program based on cacti and works with a simple perl script. How it really works describes the following picture.

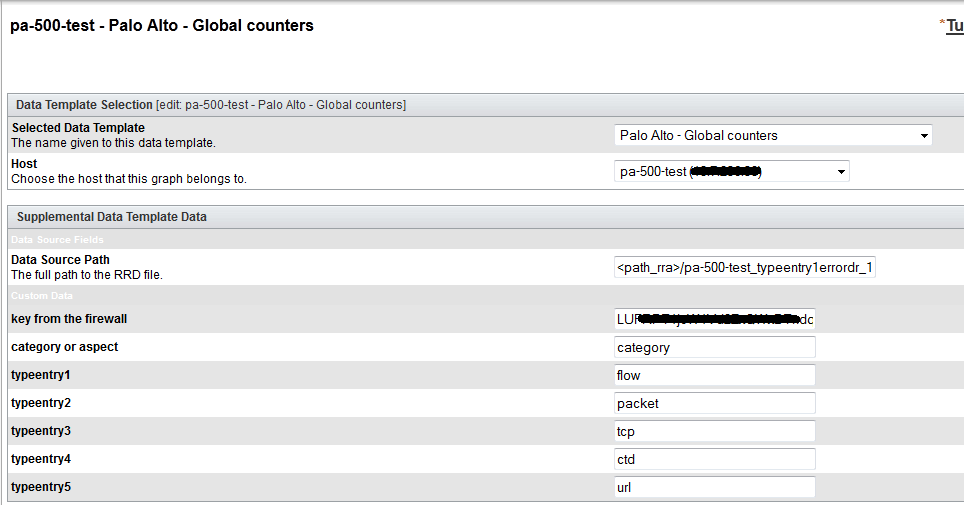
The script collects the required counters we want to monitor. We can set the category or aspect and the category or aspect types in cacti as a custom data source.
For the login you can generate a key in the firewall (go to the link https://hostname/api/?type=keygen&user=username&password=password).
It looks like this if your are ready:
1. The scripts issues through https a command on the Palo Alto firewall. (The URI::Escape is used to URL encode special characters)
2. The firewall send the command through the https session. (use LWP::UserAgent and the HTTP::Request modules used to create https session.)
3. The scripts loads the output, it is an xml content.
4. The scripts searches through the xml all the required counters (XML::LibXML module used) and maybe summarises the different counters.
5. The scripts writes the output in the following format: attribute1:value attribute2:value attribute3…
6. The cacti takes it in rrd and makes what it has to, like for the more million installations in the world, creates a graph.

Here are the required importable xml file for cacti and the perl scripts. Please ask for help if you are not expert on cacti on cacti forum.
https://code.google.com/p/cacti-remote-scripts/source/browse/
2. Monitoring VLAN Interfaces
There are one more reason that made me create an XML API based monitoring. The reason is the vlan traffic monitoring with xml api, since it is not reachable in the current SNMP MIB.
I think all the counters should be reachable via SNMP, but the neither Cisco nor Palo Alto nor the other Security Companies makes any development on SNMP as I feel. Even if that could be so simple.
In Palo Alto the Interfaces has another counters as a Cisco ASA it is not as granular as Cisco but has more built in security counters.
In the current version the counters are:
General traffic counters
ibytes – bytes received
obytes – bytes transmitted
ipackets – packets received
opackets – packets transmitted
Counters for Errors
ierrors – receive errors
ifwderrors – forwarding errors
Counter for Drops
idrops – packets dropped
flowstate – packets dropped by flow state check
Counters for basic Network Problems
noroute – no route
noarp – arp not found
noneigh – neighbor not found
neighpend – neighbor info pending
nomac – mac not found
Informational counters…I dont monitor it.
zonechange – packets routed to different zone
icmp_frag – ICMP fragment
l2_encap – layer2 encapsulated packets
l2_decap – layer2 decapsulated packets
Basic (Old) Attack counters (It sound like it is enough to count them, but no interaction needed :-))
land – land attacks
pod – ping-of-death attacks
teardrop – teardrop attacks
ipspoof – ip spoof attacks
macspoof – mac spoof attacks
This groups comes from me and I use it in the script. The uniqe counters to monitor is too much. for example the attack counters will be summarized.
If it start to increase it must be checked with counter started to increase and analyse why.
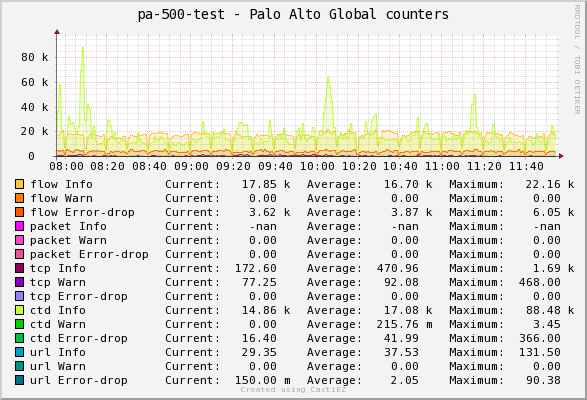
graphs pictures as an example:

Link for the xml graph templates and perl scrips:
https://github.com/itsecworks/cacti-remote-scripts
Next time I will take my free time to get better know Graph mit Yed under linux (or windows). Look back in November.

rk4k
March 17, 2015
I.m running
https://hostname/api/?type=keygen&user=username&password=password
The only result is like below :
–
-<result
-keycodeblablablablablabla
and no other atribut , value to show
itsecworks
April 6, 2015
It generates only a keycode…what do you expect?
Matbro51
May 4, 2016
Is there anywhere I can download this now the Google Code downloads aren’t available? Thanks!
John
January 5, 2017
I would very much like these templates too as they are just what I am looking for.
itsecworks
April 11, 2017
https://github.com/itsecworks/cacti-remote-scripts
Hien The
August 28, 2016
I been run Ubuntu 16.04 LTS and install all the necessary perl module to run the get_pa_global_counters.pl and get_pa_interface_counters.pl but error message:
SSL connect attempt failed error:14090086:SSL routines:ssl3_get_server_certificate:certificate
After googling and I found this link that help me to fix the script:
https://bugs.launchpad.net/ubuntu/+source/libwww-perl/+bug/1408331
I change the code
#my $ua = LWP::UserAgent->new(ssl_opts => { verify_hostname => 0 });
my $ua = LWP::UserAgent->new(ssl_opts => { SSL_verify_mode => 0 });
EM
July 1, 2021
Hi, I’m running Cacti 1.2.2 and not able to import your template (tried with cacti_graph_template_palo_alto_global_counters.xml and Cacti gives XML parse error). Do you happen to have newer versions of this? My goal is to have some of the Palo global counters monitored. Thanks!