On packetpushers.net somebody wrote an articel about automatically get the outputs of show command of the cisco asa with lynx.
That makes it possible to see if a specific counter for a feature, service or process or just interface counter changes, mainly increases, but you cannot see the size of the increase.
In troubleshooting it is a key information if a specific counter affected by an issue, changes too much, but we cannot be sure if it really affects the current problem we have or not, if we check it only when we got some problem.
Thats why we should monitor it/graph it to have better understand how much the suspected counter in case of an issue is relevant.
A really easy example if we have a layer 2 problem and we see interface drop counters increasing we can thing it is relevant to our issue, but we dont know if the drops were there before our issue or not.
It can mislead us if we havent checked them earlier when there were no layer 2 problem, but maybe there were drops earlier too.
Showing it on a graph can give us more information than just identifying a general increase, it can show us a true anomaly.
For that purpose we can put on graph actually everything to analyse the state of your firewall and any other network devices too! :-)
In network enviroment the mostly used monitoring service is snmp, but there are other ways as well to monitor our network devices.
Just to show that for you I did some pictures about asp drops and inpsection drops and vpn traffics from a cisco asa firewall with perl scripts (without snmp!).
Those you can see in the following picture:
Monitoring ASP Drops on Cisco ASA 1.
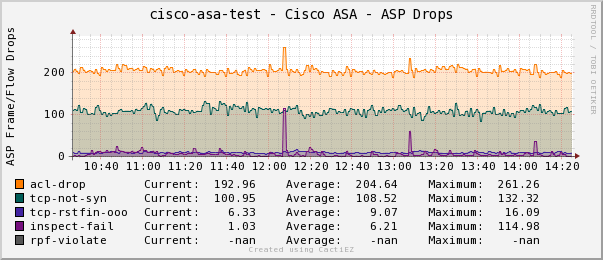 Monitoring ASP Drops on Cisco ASA 2.
Monitoring Inspection on Cisco ASA
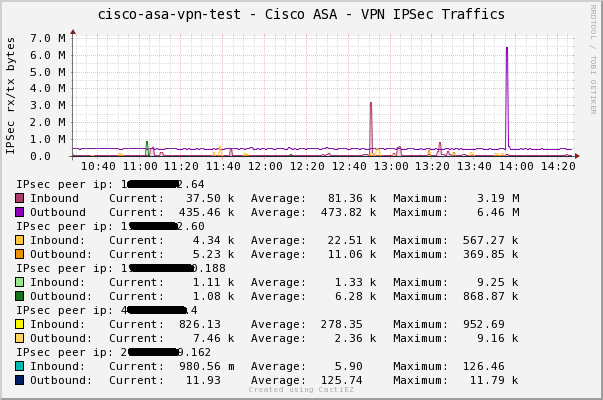
Monitoring 5 IPSec Peers Traffic on Cisco ASA
Monitoring Interface drops on Cisco ASA

Interface drops, errors, collisions with Cacti
Monitoring Threat-detection on Cisco ASA
Do you want to see it? Then pay for it! :-)
To be able to create self-made custom graphs, you only need following knowledge – but not even a 15 cent, since they are all free:
- really basic skills of perl
- really basic skills of php
- high skills of rrdtool
- sufficient skills of cacti (webui)
- sufficient skills of mysql
- sufficient skills of apache
Find you that too much for you? A good news is, that you can save your time and reduce those skills to only 3 required skills if you use cactiez iso image:
- really basic skills of perl
- high skills of rrdtool
- sufficient skills of cacti (webui)
In the next sections I try to summarize how to create those graphs what informations are required for them. I have made it in 4 sections:
- Cacti monitoring and graphing tool
- Cactiez Installation (Cacti Made Easy)
- Install host template for Cisco ASA Firewall
- Custom Monitoring of Cisco ASA Firewall (Example)
1. Cacti monitoring and graphing tool
Cacti is an open-source, web-based network monitoring and graphing tool
designed as a front-end application for the open-source, industry-standard data logging tool RRDtool.
I made a topology of the settings from Cacti to be able understand easer what the tousand Menus are for and what we need from thore.
Configuration steps for a simple snmp query:

Configuration steps for a remote script
 The difference between simple snmp query and remote script is a step where you define a new Data Input Method for the remote script. For simple snmp query there is a built in Data Input Method.
In the following table I summarize the required Cacti Items, that must be configured:
| Cacti Item Name | Description | RRDTool Reference |
| Data Input Method (Input Fields & Output Fields) | Here must we define in case of remote script the input and output fields, that define the filtering for multiple input and output values. | The output fieldnames will match the names of the data sources, used for rrd |
| Data Template | This is the interface between the script output values and the data sources of rrd. | The type and min, max values and the heartbeat will be defined here for data sources. |
| Graph Template (Graph Template Items) | This is the place where we defince the datasources, that will be presented in the graph and the colors, graph size, etc… | The rrd graph settings |
| Data Source | Here we will define with which data template and with which device should we take the values to be presented in the graph. | The actual rrd file. |
| Device | This represents the monitored device, that was earlier configured with an IP address. | This has nothing to do with rrdtool. |
| Graph | Here we have to define which device with which graph template should be presented in a graph and for the graph template which data source to use. | The issued rrdtool graph command can be seen here. |
I made a configuration topology of Cacti graph for indexed snmp query, simple snmp query and for remote script. The aim of this topology is to represent the
dependencies of the required configurations steps. It can help you too, maybe:Cacti_Configuration_Topology
RRDTool is something that I dont want to detail now :-) just read the wikipedia sites for quick info
http://en.wikipedia.org/wiki/Cacti_(software)
http://en.wikipedia.org/wiki/Rrdtool
or for deeper information read first the rrdtool tutorial (not the man pages or the documentation since they are not for first steps.)
http://oss.oetiker.ch/rrdtool/tut/rrdtutorial.en.html
and than the tutorial from cacti
http://docs.cacti.net/manual:088:2_basics.1_first_graph#my_first_graph
The next step, if you are not a Cacti expert or have any experiences with Cacti, is to insall Cactiez. The Cactiez is a simplified installation of Cacti on Centos.
You can install it as a virtual host in any virtualization software like VMware or Virtualbox or on any hardware supported by Centos. To get the preinstalled Cacti with weathermap support use this link:
http://cactiez.cactiusers.org/
2. Cactiez Installation (Cacti Made Easy)
Typical steps where human interaction required for the cactiez installation (in virtual enviroment in my case):
- Multiple interfaces – only one will be installed and configured.If you want to set all of your interface use this link:http://www.centos.org/docs/5/html/Deployment_Guide-en-US/s1-networkscripts-interfaces.htmlExample config:
[root@localhost ~]# cat /etc/sysconfig/network-scripts/ifcfg-eth0
DEVICE="eth0"
BOOTPROTO="dhcp"
HWADDR="08:00:27:91:D8:DA"
NM_CONTROLLED="yes"
ONBOOT="yes"
TYPE="Ethernet"
- Set Language and timezone, clock and keyboard language.
- Set the operating system user, the root password.
- Set Partition table, use full disk on virtual machine.
- Reboot after install.
- Do not forget to setup NTP. http://www.hypexr.org/linux_date_time_help.php
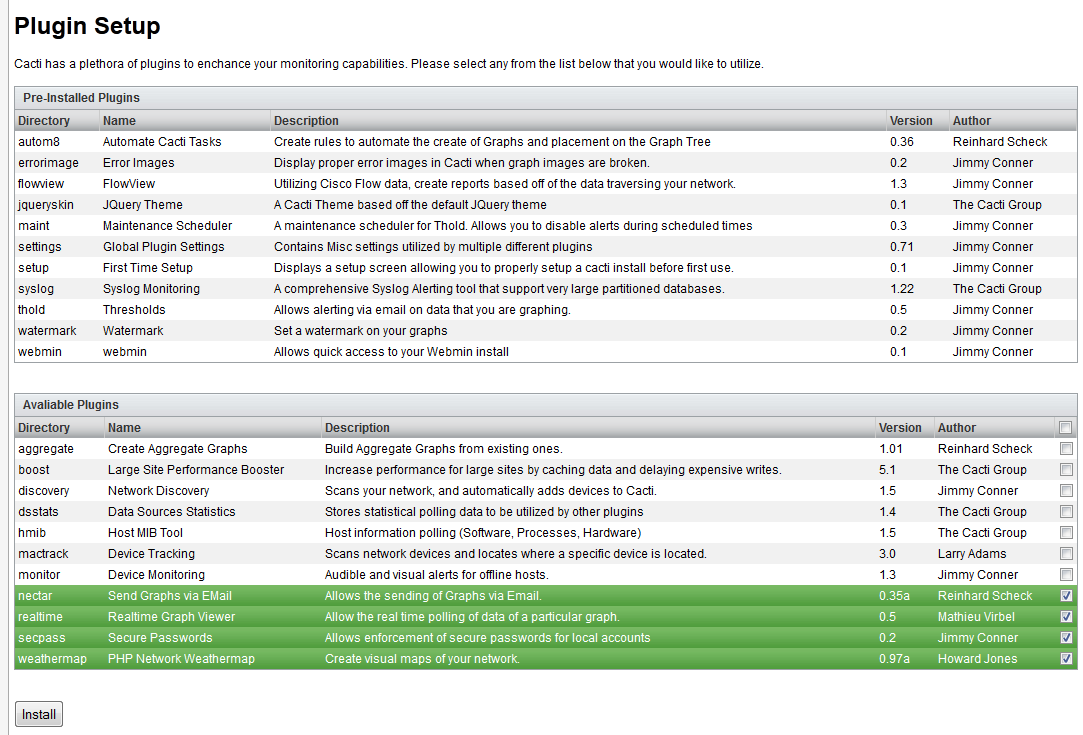
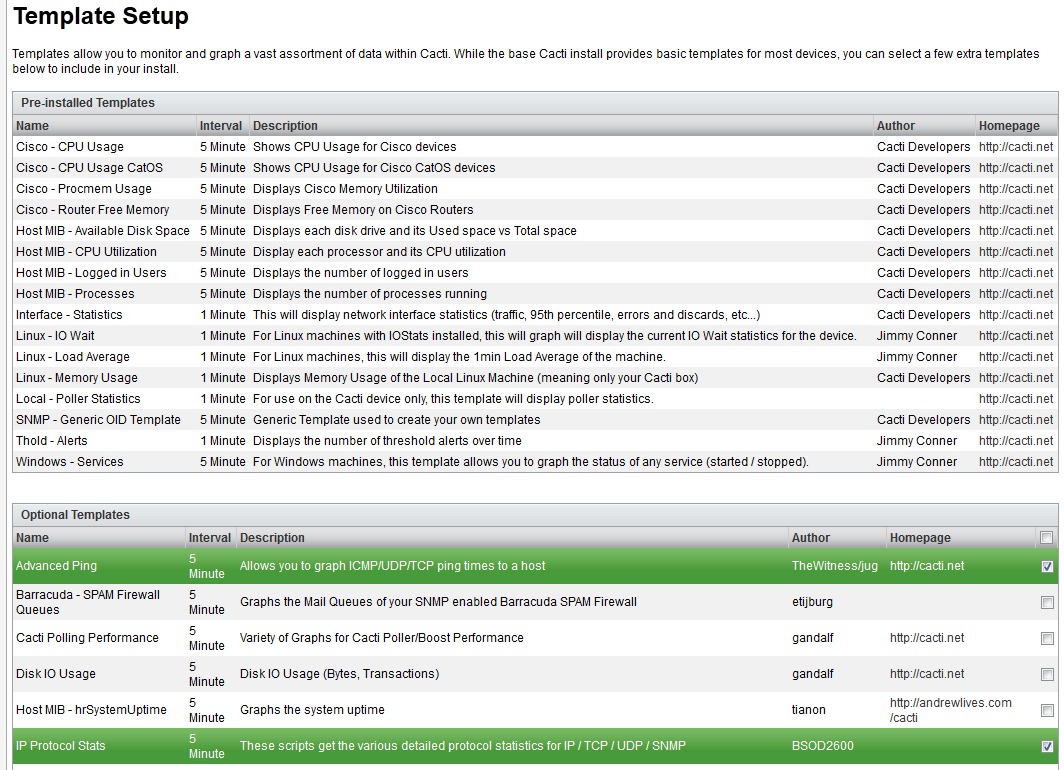
- At first login install the plugins required from default list. See the list I activated in the screenshot.
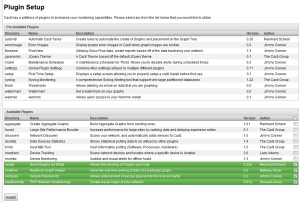
- At first login install the templates required from default list. See the list I activated in the screenshot.

- Set the DNS and Email Address for Cacti too.
The default usernames and passwords are documented on the official site.
http://cactiez.cactiusers.org/docs/logininfo.html
Update your system with yum. See the list for basic yum commands:
http://yum.baseurl.org/wiki/YumCommands
# vi /etc/yum.conf

# The proxy server - proxy server:port number
proxy=http://yourproxy.com:80
# The account details for yum connections
proxy_username=yourusername
proxy_password=yourpassword
# yum check-update
# yum update
Install the following packages required as a networker (for example there is no nslookup by default on centos):
(ipcalc under centos is shity, but by default installed.)
# yum install lynx
# yum install nc.x86_64
# yum install nmap
# yum install tcpdump
# yum install bind-utils
3. Install host template for Cisco ASA Firewall
- Install cisco asa template after initial wizard (plugin install, dns settings and email settings..) of cacti
Cisco ASA Host Template for Cacti:http://docs.cacti.net/usertemplate:host:cisco:asa_55xx
Download the file cacti_host_template_cisco_asa_-_security_appliance.xml-2.zip
The documentation on extract and import new host template in Cacti can be found here:
http://www.cacti.net/downloads/docs/html/template_import.html(The associated RRAs I have set to hourly/daily/weekly/monthly. See it the picture below.)
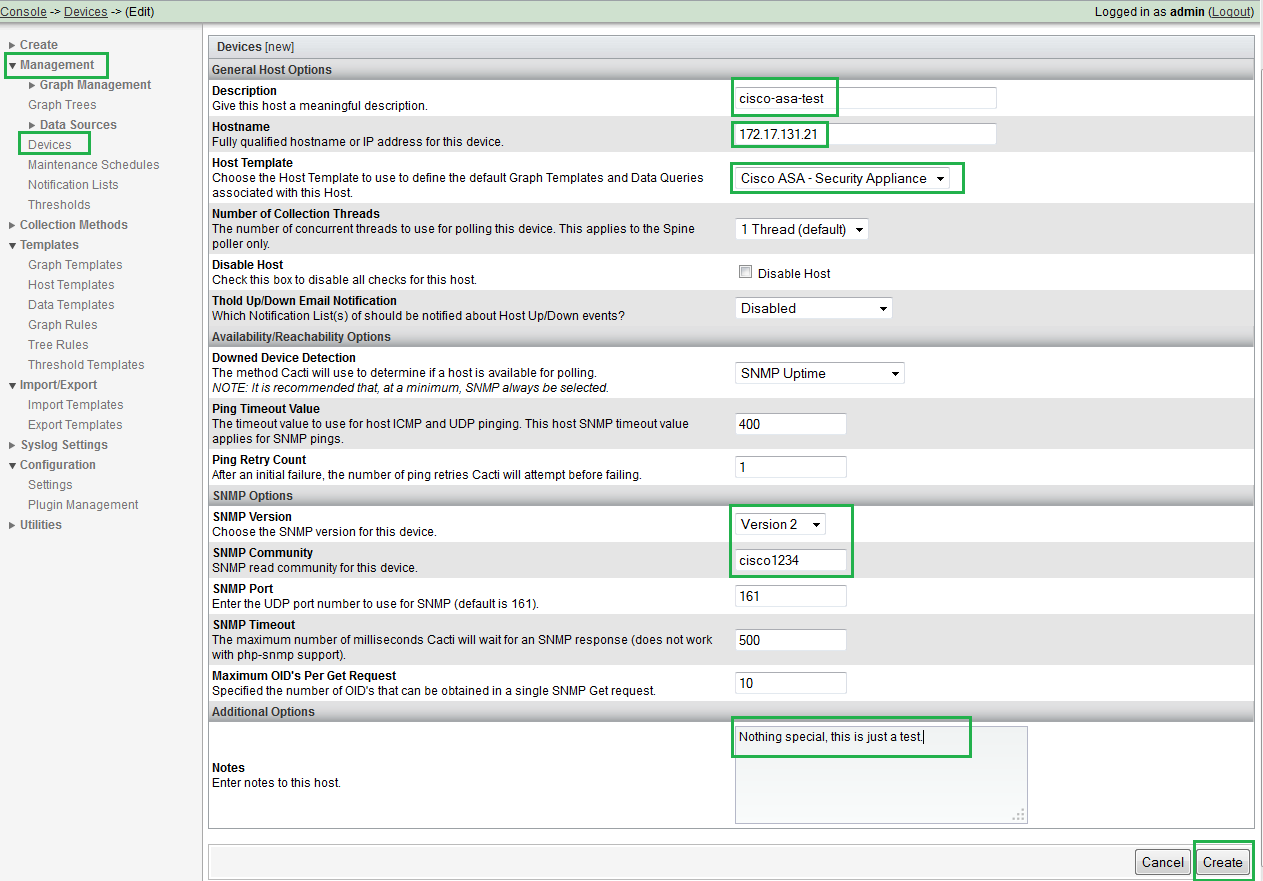
- Add your Cisco ASA as a new device and its graphs
- Add device
- Add a name (hostname of your firewall)
- Define template. Host template is Cisco ASA -Security Appliance
- You should configure the ASA first for SNMP and after then the Cacti Server
- Add device

snmp-server host inside 172.16.7.223 community cisco1234 version 2c udp-port 162 snmp-server location My Location of the Firewall snmp-server contact itguys@cisco.com snmp-server community cisco1234 snmp-server enable traps snmp authentication linkup linkdown coldstart warmstart |
- Set snmp version and community string
- Choose Associated Graph Templates. By default all associated templates will be added to device
- Add the device to graph tree to be able to see it. Use the default tree for test
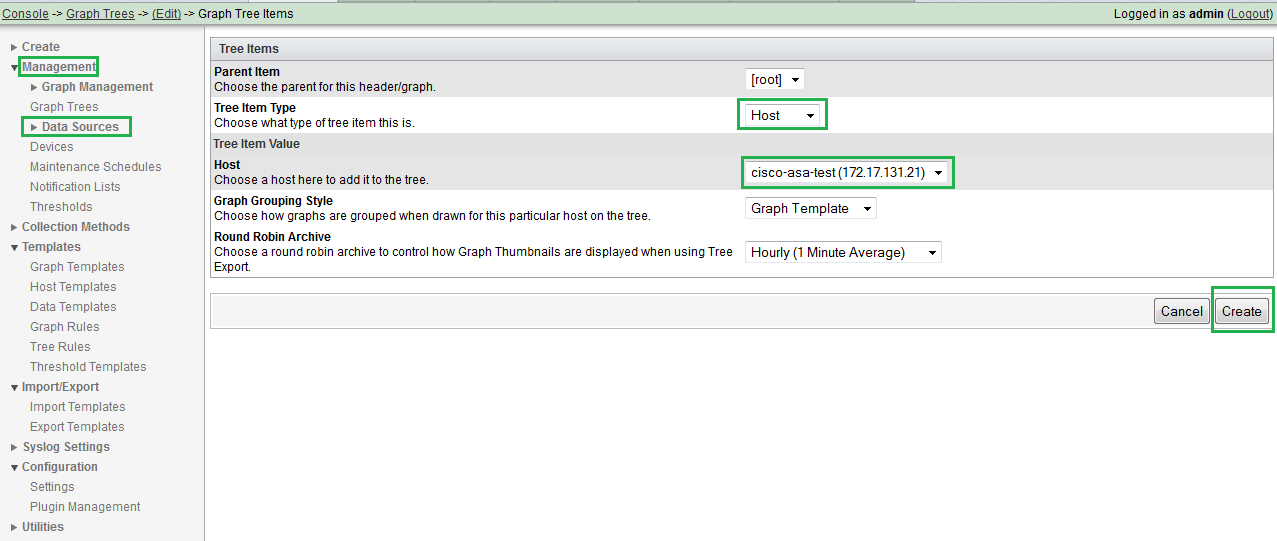
- Add graph-tree item (the cisco asa firewall). See picture below:

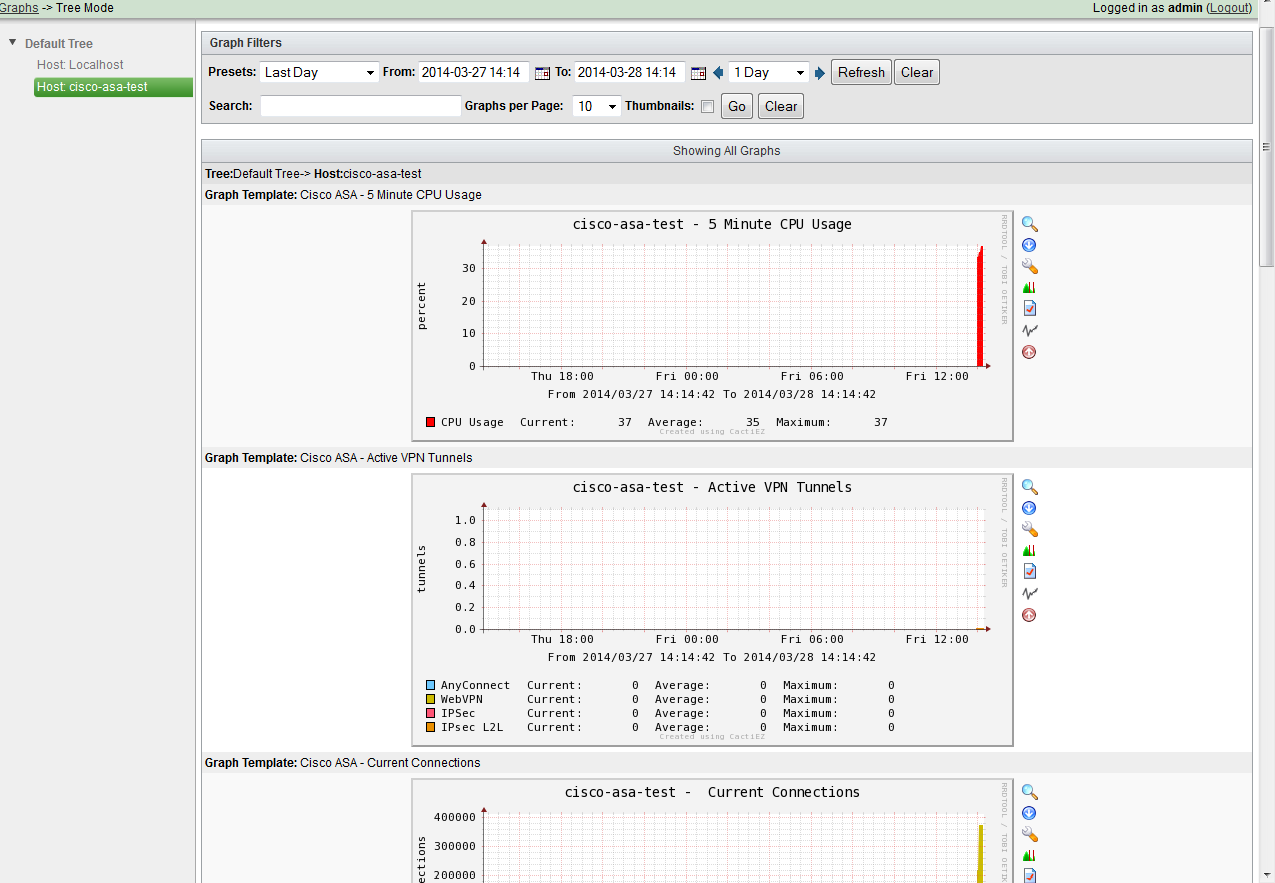
If everything is fine, you should see the following graphs of the cisco asa currently imported.
4. Custom Monitoring of Cisco ASA Firewall
The values, you can see on the new graphs from the new cisco asa device, are mostly return values through SNMP Queries. You can get this vaules with snmpwalk command too if you wanna test it.
Lets see an example how snmp query works, for the test use snmpwalk from cli:
[root@localhost ~]# snmpwalk -v 2c -c cisco1234 122.10.13.2 1.3.6.1.4.1.9.9.147.1.2.2.2.1 SNMPv2-SMI::enterprises.9.9.147.1.2.2.2.1.3.40.6 = STRING: "number of connections currently in use by the entire firewall" SNMPv2-SMI::enterprises.9.9.147.1.2.2.2.1.3.40.7 = STRING: "highest number of connections in use at any one time since system startup" SNMPv2-SMI::enterprises.9.9.147.1.2.2.2.1.4.40.6 = Counter32: 0 SNMPv2-SMI::enterprises.9.9.147.1.2.2.2.1.4.40.7 = Counter32: 0 SNMPv2-SMI::enterprises.9.9.147.1.2.2.2.1.5.40.6 = Gauge32: 419605 SNMPv2-SMI::enterprises.9.9.147.1.2.2.2.1.5.40.7 = Gauge32: 1001000 |
On the following link you can see some other snmp queries for Cisco ASA VPN.
snmpwalk example
The cisco asa has a lot of show commands to check for example the actual state of its interfaces, processes, inspections, vpn states and so on.
Not all of those states/values have currently snmp extensions, but with a remote script it is even possible to graph everything, for example the different counters of asp-drops.
The currently available SNMP MIB for Cisco ASA can be checked here. Maybe there is already an OID for the thing you are looking for.
Here are the currently reachable SNMP MIB for Cisco ASA:
http://jklogic.net/fwsm-snmp-oid-info/
Adaptive Security Appliance MIB Support List:
ftp://ftp.cisco.com/pub/mibs/supportlists/asa/asa-supportlist.html
To be able to use custom monitoring first lets see how a remote perl script works before we start to create our own monitoring.
For that configuration first lets see the remote script part of my configuration topology, see page 9-12:Cacti_Configuration_Topology.pdf
In my perl scripts I use lynx for https session instead of a raw perl code. To be able to use my script, this link must be read, it is about using lynx for show command from cli:https://itsecworks.com/2013/12/10/lynx-for-cisco-asa-management/
Note:
In the cacti configuration you can save your username and password only in clear text. It is not required if you use ssh public keys with ssh, since the newest cisco asa software makes it possible to login with ssh public key.
http://www.cisco.com/c/en/us/td/docs/security/asa/command-reference/cmdref/s20.html#pgfId-1617284
It an be your homework if you feel the power and you can create a new script without lynx and only with ssh modul in perl.
The example script named get_asa_asp_drop.pl should be copied to /var/www/html/scripts with the following content:
#!/usr/bin/perl
# Author: Akos Daniel daniel.akos77ATgmail.com
#
# Filename: get_asa_asp_drop.pl
# Current Version: 0.1 beta
# Created: 4th of April 2014
# Last Changed: 4th of April 2014
# -----------------------------------------------------------------------------------------------
# Description:
# -----------------------------------------------------------------------------------------------
# This is a rather crude and quick hacked Perl-script to get multiple values from show asp drop command.
# The drop reasons (max 5) should be defined in command.
# Syntax:
# -------
# get_asa_asp_drop.pl    <drop_reason1> <drop_reason2> <drop_reason3> <drop_reason4> <drop_reason5>
#
# Mandatory arguments:
# --------------------
#  : The IP of the cisco asa firewall.
#  : Username for a readonly user.
#  : Password of the user.
# <drop_reason1> : in this script max 5 drop reasons can be monitored. Just define the drop reason name. The full ist can be seen in asp_drop_atts.txt
#
# Example:
# --------
# ./get_asa_asp_drop.pl 172.16.20.1 cisco cisco123 acl-drop tcp-not-syn tcp-rstfin-ooo
#
# This will give outputs of the required drops reasons
# -----------------------------------------------------------------------------------------------
# Known issues:
#
# -----------------------------------------------------------------------------------------------
# [solved]
# -----------------------------------------------------------------------------------------------
# Change History
#
# -----------------------------------------------------------------------------------------------
# 0.1 beta: (4th of April 2014)

# Example output:
#
# Frame drop:
#  Flow is being freed (flow-being-freed)                                       3
#  Invalid IP header (invalid-ip-header)                                        1
#  Reverse-path verify failed (rpf-violated)                               260084
#  Flow is denied by configured rule (acl-drop)                          29307676
#  Flow denied due to resource limitation (unable-to-create-flow)               3
#  First TCP packet not SYN (tcp-not-syn)                                15606697
#  Bad TCP flags (bad-tcp-flags)                                             1804
#  TCP data send after FIN (tcp-data-past-fin)                                  1
#  TCP failed 3 way handshake (tcp-3whs-failed)                             52295
#  TCP RST/FIN out of order (tcp-rstfin-ooo)                              1265527

use strict;

my $cisco_cmd = "show asp drop";
my $output = `lynx -auth=$ARGV[1]:$ARGV[2] -width 100 -dump "https://$ARGV[0]:443/exec/$cisco_cmd"`;

foreach my $line (split /[\r\n]+/, $output) {
	if (defined $ARGV[3] && $line =~ /.*\s\($ARGV[3]\)\s+(\d+)/m) {
		print "dropr1:",$1," ";
	}
	elsif (defined $ARGV[4] &&  $line =~ /.*\s\($ARGV[4]\)\s+(\d+)/m ) {
		print "dropr2:",$1," ";
	}
	elsif (defined $ARGV[5] && $line =~ /.*\s\($ARGV[5]\)\s+(\d+)/m ) {
		print "dropr3:",$1," ";
	}
	elsif (defined $ARGV[6] && $line =~ /.*\s\($ARGV[6]\)\s+(\d+)/m ) {
		print "dropr4:",$1," ";
	}
	elsif (defined $ARGV[7] && $line =~ /.*\s\($ARGV[7]\)\s+(\d+)/m ) {
		print "dropr5:",$1," ";
	}
}
|
Lets test the script with 3 drop reasons from the cli of our cacti server:
$ ./get_asa_asp_drop.pl 172.16.20.1 cisco cisco123 acl-drop tcp-not-syn tcp-rstfin-ooo dropr1:8314017 dropr2:12345 dropr3:123456 |
In the output you cannot see the names of the drop reasons, but the position given as argument in the command. Cacti will use this information.
After that the cacti should just be configured according to the following manual. See the pdf for the configuration:Cacti_Configuration_Steps.pdf
If you do not want to create the input methods and data templates and graph templates on your own you can use my exported template.
I have exported the graph template with all dependencies. Just import it if you do not want to bother with the cacti configuration.
the scripts and the graph templates with dependencies are stored currently on google:
https://code.google.com/p/cacti-remote-scripts/source/browse/
Import the xml file in cacti as graph template and put the perl scripts to your_path_to_cacti/scripts/. In my case it is /var/www/html/cacti/scripts.
Thats all now folks… :-)

jay
September 22, 2014
Hello, very useful. Asp drops is working fine. I was also interested in get_asa_interface_drops.pl perl script but actually there is not xml file graph template for it and Cacti_Configuration_Steps.pdf is missing.
itsecworks
September 22, 2014
I managed to upload it!!! :-)
https://code.google.com/p/cacti-remote-scripts/source/browse/
The config steps are easy:
1. import the xml file in cacti.
2. upload the perl script to cacti.
3. the rest is a general cacti settings.
Should I demonstrate it for you with a youtube video?
jay
September 23, 2014
I’ve been trying the last 2 hours to make it working, surely I’m missing something. Actually asp drops and vpn ipsec tunnels are working fine but interface drops and inspection still doesn’t works. A youtube video can surely help me understand what I’m missing
Thanks
jay
September 23, 2014
got it working now :) but how can I have ge int names on graphs ?
itsecworks
September 24, 2014
Mea culpa, but you could solve it yourself if you spend a little time with cacti and with the manuals. :-)
I have updated the post and the xml file to. Please visit the page https://code.google.com/p/cacti-remote-scripts/source/browse/
and download the xml file for interface drops again.
If you wanna understand what I did to see the interface name on graph, please read further.
1. Required supplemental data for the Data Source:
Console->Management->Data Sources->”Cisco ASA – Interface Drops”->Supplemental Data Template Data->username: Your-USerName
Console->Management->Data Sources->”Cisco ASA – Interface Drops”->Supplemental Data Template Data->password: Your-Password
Console->Management->Data Sources->”Cisco ASA – Interface Drops”->Supplemental Data Template Data->interface to monitor: Your-Interface-Name
2. Super feature from Cacti: Using data input field in Graph template everywhere
Syntax: |input_|
Example: |input_interface|
Link (I dont know where is it officially documented, i’ve found pnly this):
http://forums.cacti.net/viewtopic.php?p=224761#p224761
In our case it is:
Console->Templates->Graph Templates->Cisco ASA – Interface Drops->Item#1->Text Format: |input_interface|
(Sometimes the interface name does not appear. It helps if you open the graph template and save it again, even if you havent changed it.)
The only things you need to remember: Data Input Method->Data Templates->Data Sources->Graph Templates->Host Graph
jay
September 28, 2014
The only one I can’t got it working is ./get_asa_inspects.pl, it doesn’t show any output,
[root@cacti scripts]# ./get_asa_inspects.pl 10.2.2.252 cisco ciscopassword dns ftp sip icmp tftp
[root@cacti scripts]#
itsecworks
September 28, 2014
Its not that bad, since the script works et least for 2 persons. :-)
Can you start a perl debug and check the variables? Or should I add control points to the code?
james
December 18, 2014
Jay for example, i have the same problm, i lunch url by lynx, i saw the differency
anwser:
Inspect: skinny , packet 166, drop 21, reset-drop 0, v6-fail-close 0
regex:
Inspect: $inspectedprotocol3.*,\spacket\s(\d+),\slock\sfail\s(\d+),\sdrop\s(\d+),\sreset-drop\s(\d+)/m) {
print “inspectedproto3-pkts:”,$1,” inspectedproto3-drps:”,$2+$3+$4,” “;
for me modify regex because no had Inspect:” slock\sfail\s(\d+)” but had v6-fail-close
new regex:
Inspect: $inspectedprotocol3.*,\spacket\s(\d+),\sdrop\s(\d+),\sreset-drop\s(\d+),\s v6-fail-close\s(\d+)/m) {
print “inspectedproto3-pkts:”,$1,” inspectedproto3-drps:”,$2+$3+$4,” ”
enjoy dude, thanks
itsecworks
December 25, 2014
Since the output is based on the SW Release, you have to update the script to your SW Release’s output :-)
Thanks James.
Christer
June 3, 2016
This example really helped to take ASA monitoring to next step. we have made other monitor as well and replace lynx with curl.
dave
March 13, 2019
Can you repost the downloads at https://code.google.com/p/cacti-remote-scripts/source/browse/ ?
itsecworks
March 31, 2021
its still available in google:
https://code.google.com/archive/p/cacti-remote-scripts/source/default/source