Hi there, that title sounds very funny right? :-P We heared about IaC already, but nothing about L2aC…?
No worry I have not invented anything, I just call my network topology documentation tool as L2aC.
The background story short:
10 years before I had to support the network guys in their job and I hated typing multiple cli commands every time on many switches just to get an up-to-date topology to help the site in its connectivity issues.
I decided that I will script that activity and have written a little script for securecrt (SecureCRT is very good, it has built in python you can script ssh and do what ever you like on infra devices, like switches or routers or firewalls!)
I used as always graphviz and found no other way to create a visual representation for a switch then an HTML table:

This is how I started to present a switch. So to get a Layer 2 topogoly I used 3 cli commands on Cisco switches from SecureCRT script:
show inventory – gives us the units in stack with their id like below the “Switch 2” and “Switch 3” and “Switch 4” on C38XX Series, on 2960 Series its just a number:
Switch#show inventory
NAME: “c38xx Stack”, DESCR: “c38xx Stack”
PID: WS-C3850-48U-L , VID: V06 , SN: FOC2238X0HT
NAME: “Switch 2“, DESCR: “WS-C3850-48U – Provisioned“
PID: WS-C3850-48U , VID: , SN:
NAME: “Switch 3“, DESCR: “WS-C3850-48U – Provisioned”
PID: WS-C3850-48U , VID: , SN:
NAME: “Switch 4“, DESCR: “WS-C3850-48U – Provisioned”
PID: WS-C3850-48U , VID: , SN:
show interface status – gives us the interface types like gigabit or fastethernet or terabit ethernet on port level:
Switch# show interface status
Port      Name               Status       Vlan       Duplex  Speed Type
Gi1/0/1                      connected    1          a-full a-1000 10/100/1000BaseTX
Gi1/0/2                      connected    1          a-full a-1000 10/100/1000BaseTX
Gi1/0/3                      connected    1          a-full a-1000 10/100/1000BaseTX
Gi1/0/4                      notconnect   1            auto   auto 10/100/1000BaseTX
Gi1/0/5                      notconnect   1            auto   auto 10/100/1000BaseTX
Gi1/0/6                      notconnect   1            auto   auto 10/100/1000BaseTX
Gi1/0/7                      notconnect   1            auto   auto 10/100/1000BaseTX
Gi1/0/8                      notconnect   1            auto   auto 10/100/1000BaseTX
Gi1/0/9                      notconnect   1            auto   auto 10/100/1000BaseTX
Gi1/0/10                     notconnect   1            auto   auto 10/100/1000BaseTX
Gi1/0/11                     notconnect   1            auto   auto 10/100/1000BaseTX
Gi1/0/12                     notconnect   1            auto   auto 10/100/1000BaseTX
Gi1/0/13                     notconnect   1            auto   auto 10/100/1000BaseTX
Gi1/0/14                     notconnect   1            auto   auto 10/100/1000BaseTX
...truncated...
Switch#
show cdp neighbors detail – gives us the key informations about the peers and their platform and the connected interfaces. This is the base data to build a topology with code.
HQ_Route
r#show cdp neighbors detail

Device ID: HQ_Switch
Entry address(es): 10.1.1.1
Platform: Cisco WS-C2950-12, Capabilities: Trans-Bridge Switch
Interface: FastEthernet0/1, Port ID (outgoing port): FastEthernet0
Holdtime: 180 sec

-------------------------
Device ID: LOS_Router
Entry address(es):
IP address: 10.2.2.1
Platform: Cisco 2801, Capabilities: Router Switch IGMP
Interface: Serial0/1/0, Port ID (outgoing port): Serial0/2/0
Holdtime: 190 sec
Version: Cisco IOS Software, 2801 Software (C2801-ADVENTERPRISEK9-M),
Experimental Version 12.4(20050525:193634) [jezhao-ani 145]

-------------------------
Device ID: NYC_Router
Entry address(es):
IP address: 10.3.3.1
Platform: Cisco 1841, Capabilities: Router Switch IGMP
Interface: Serial0/0/1, Port ID (outgoing port): Serial0/0/1
Holdtime: 200 sec
Version: Cisco IOS Software, 1841 Software (C1841-IPBASE-M), Version 12.4(1c),
RELEASE SOFTWARE (fc1)
-------------------------
...truncated...
HQ_Router#

Floor1#show cdp neighbors detail

Device ID: Switch
Entry address(es):
Platform: cisco 2960, Capabilities: Switch
Interface: GigabitEthernet0/0, Port ID (outgoing port): FastEthernet0/1
Holdtime: 126

Version :
Cisco IOS Software, C2960 Software (C2960-LANBASE-M), Version 12.2(25)FX, RELEASE SOFTWARE (fc1)
Copyright (c) 1986-2005 by Cisco Systems, Inc.
Compiled Wed 12-Oct-05 22:05 by pt_team

advertisement version: 2
Duplex: full

Floor1#
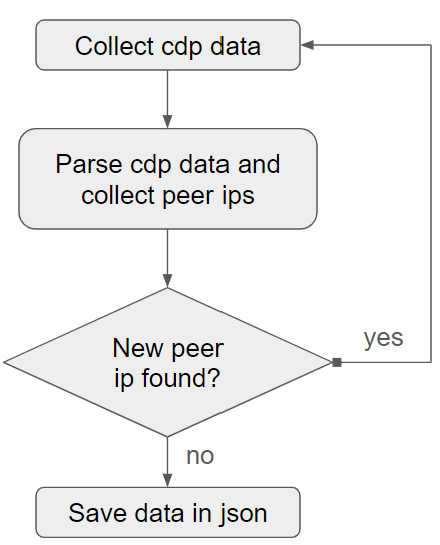
The process to collect all the cdp data from all peers its a simple loop as long as we see new devices:
And from the output I created the following layer 2 topology 10 years before with python and graphviz:

This represented me what I wanted, I had to see the layer 2 uplinks on switch level. In 2023 I decided its not realistic enough. In that form that is simply shity… :-)
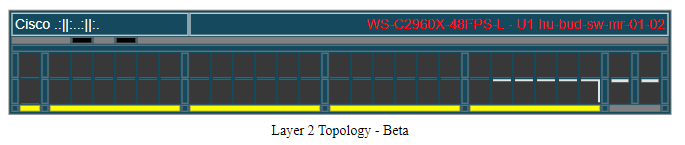
I played with html in graphviz about 2 weeks long to come to this level, that way it is more realistic and still its a vector graphic after rendering it, its an svg file at the end so you can zoom in and out you can check it on any display, you dont loose quality! (this below is just a screenshot, its not svg)
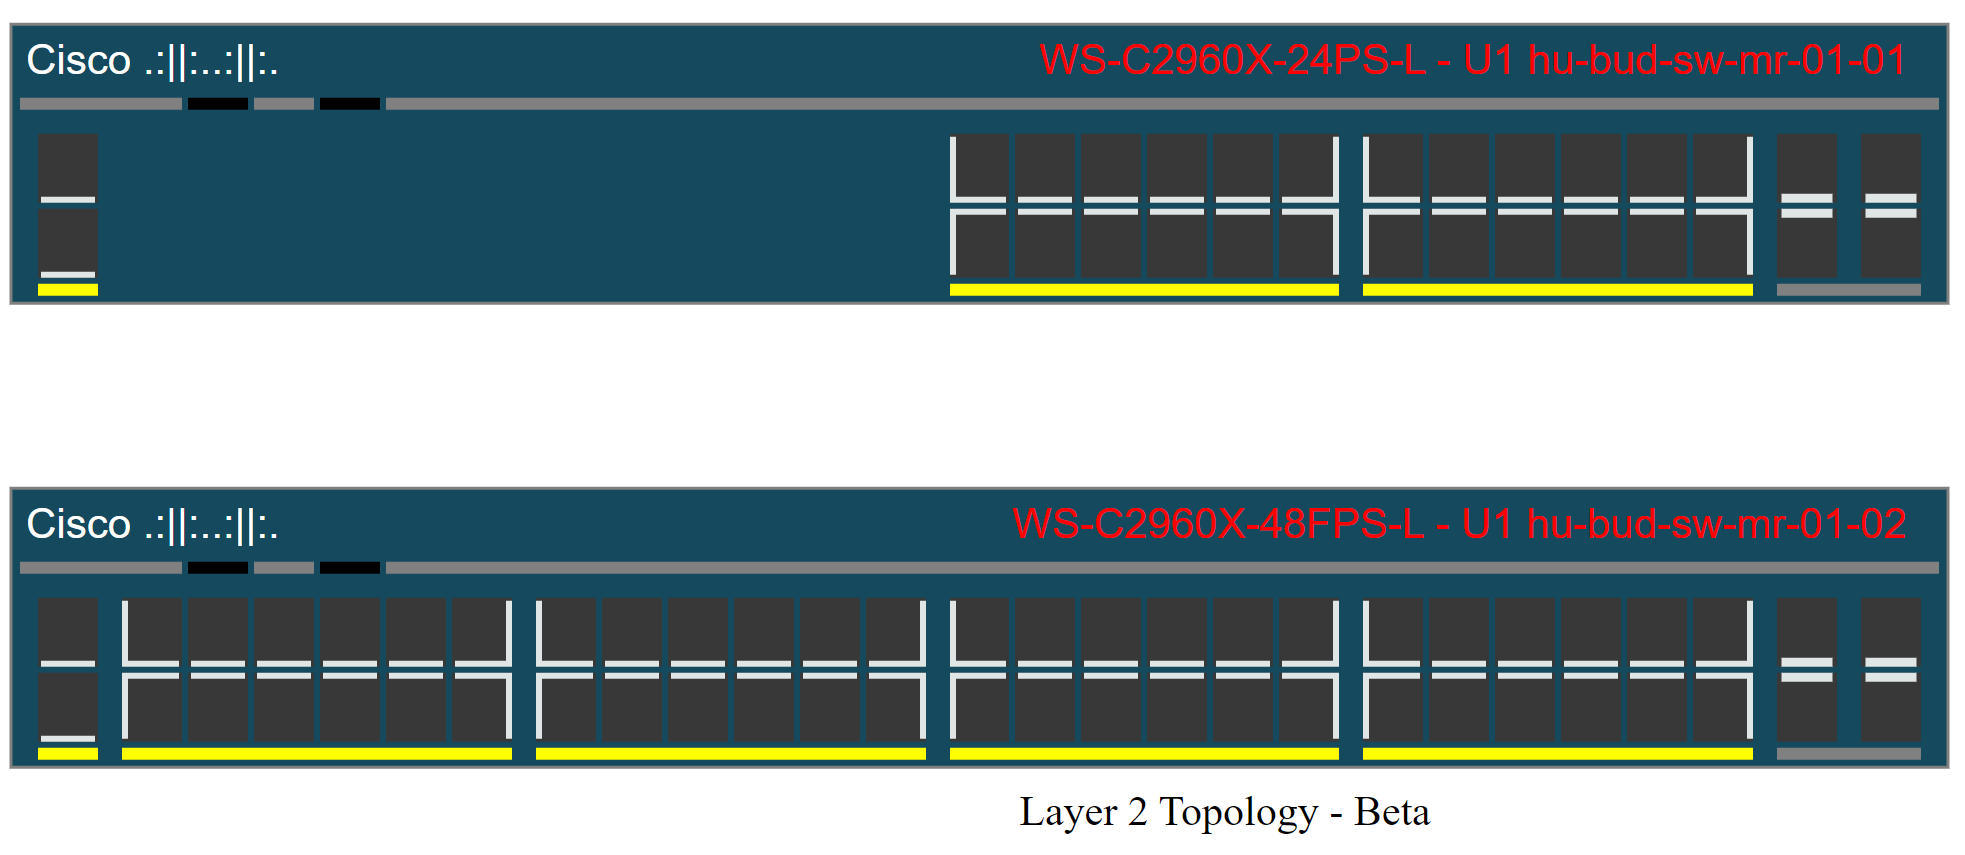
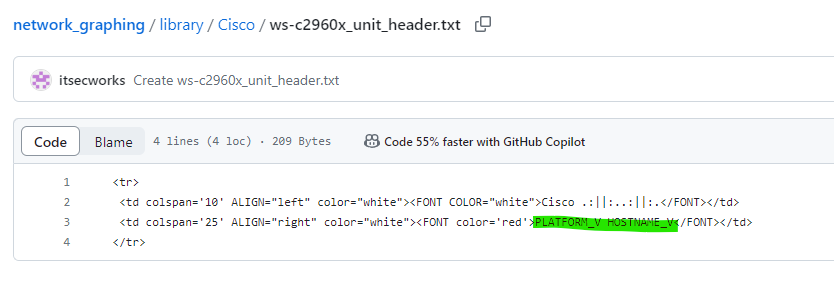
This switches and all other devices have a variable. Like if you want to put the hostname and the hardware name on the front you can do it. On the modells its the name of the variable with _V in the name (like below the PLATFORM_V and the HOSTNAME_V):
If you wanna see how this looks like on code level goto the following website:
http://magjac.com/graphviz-visual-editor/
download my graphviz example from here: https://github.com/itsecworks/network_graphing/tree/main/example
and copy and paste one of the text file to the visual editor. you can change the cellbolder to see how the table in reality looks like :-)
To visualize the structured cabling for switches in rack and and keep it for clear documentation I had to create the so called dummy nodes in graphviz. If you open the cabling_switches.txt file from github and paste the output to the visual editor and change the following for the dummy nodes:

With deleting the style attribute you will see all dummy nodes I have created from script:
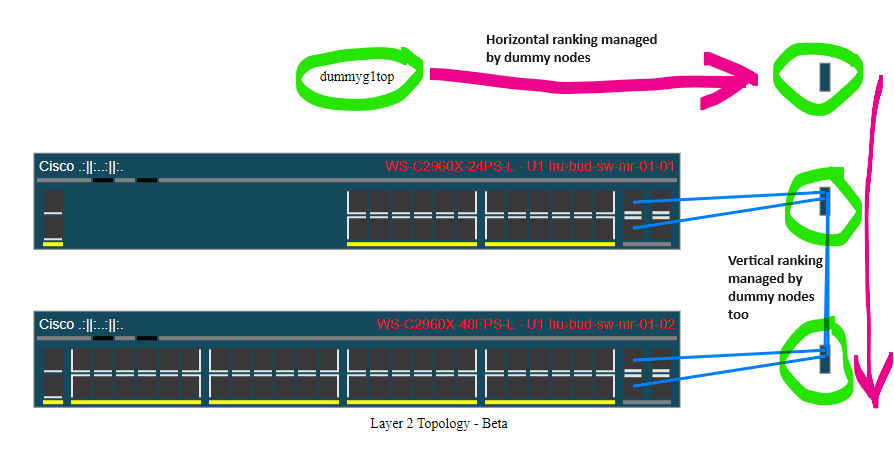
you can see that the leading of the edge (that is the cable) is managed by dummy nodes that are not presented. For the ranking of the nodes there is a horizontal and a vertical ranking with the dummy nodes. The nodes for the switches have a ranking too but it is only to define who is on the top of the rack and in which order they are in the rack. For the whole design for the cabling in graphviz I had to suffer a lot till I come to the level you see on the below screenshot, but I can tell at least I have now the knowledge to share it with anyone or to create whatever layer 2 topology I have to:
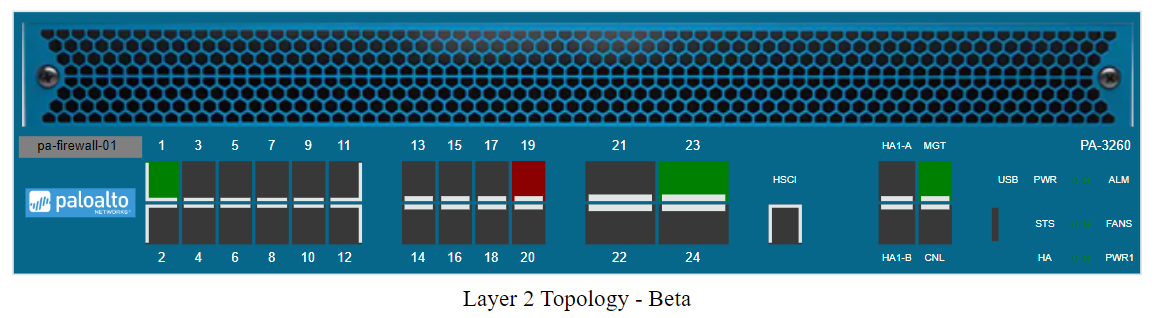
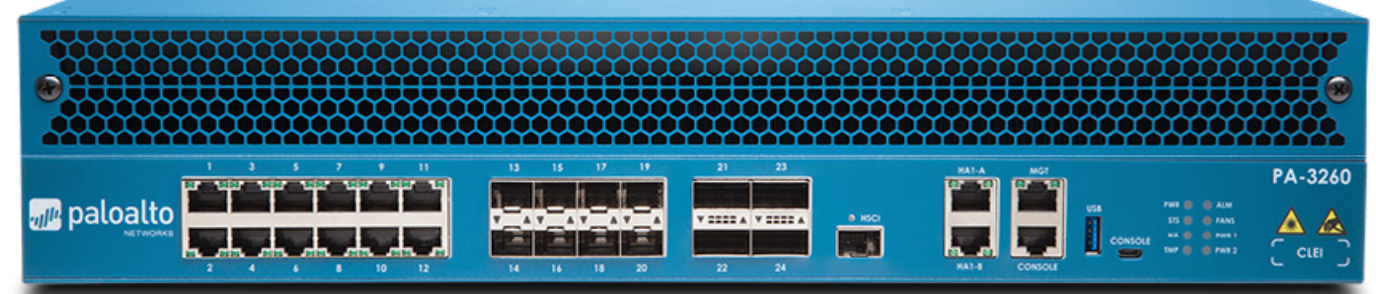
Good this is all about switches and their uplinks. Next I wanted to test how far I can go with model desinger, so I decided to create another modell from another vendor and I have choosen the PA-3260 Firewall to design from html table. :-P Here is the result, see original and the Beta I have created. I believe its realistic enough to use it for NOC in monitoring, the good stuff is that it is an svg object after the rendering you are not loosing any resolution if you see the rendered objects on smartphone or on a very large display in the NOC. Since its an html table, you can easily set the colors of the cells, like below the port1, port23 and the mgmt port is green meaning those port are up and the port19 is red, meaning the port is down. (okay some data on the right bottom corner is still missing in my node, but that was just to demostrate the possibilities of graphviz, it was not designed fully for using it in production enviroment. (Let me know if you need it, I will be more then happy to finalize it, so it can be a one-to-one match compared with the real PA-3260 hardware front panel.)
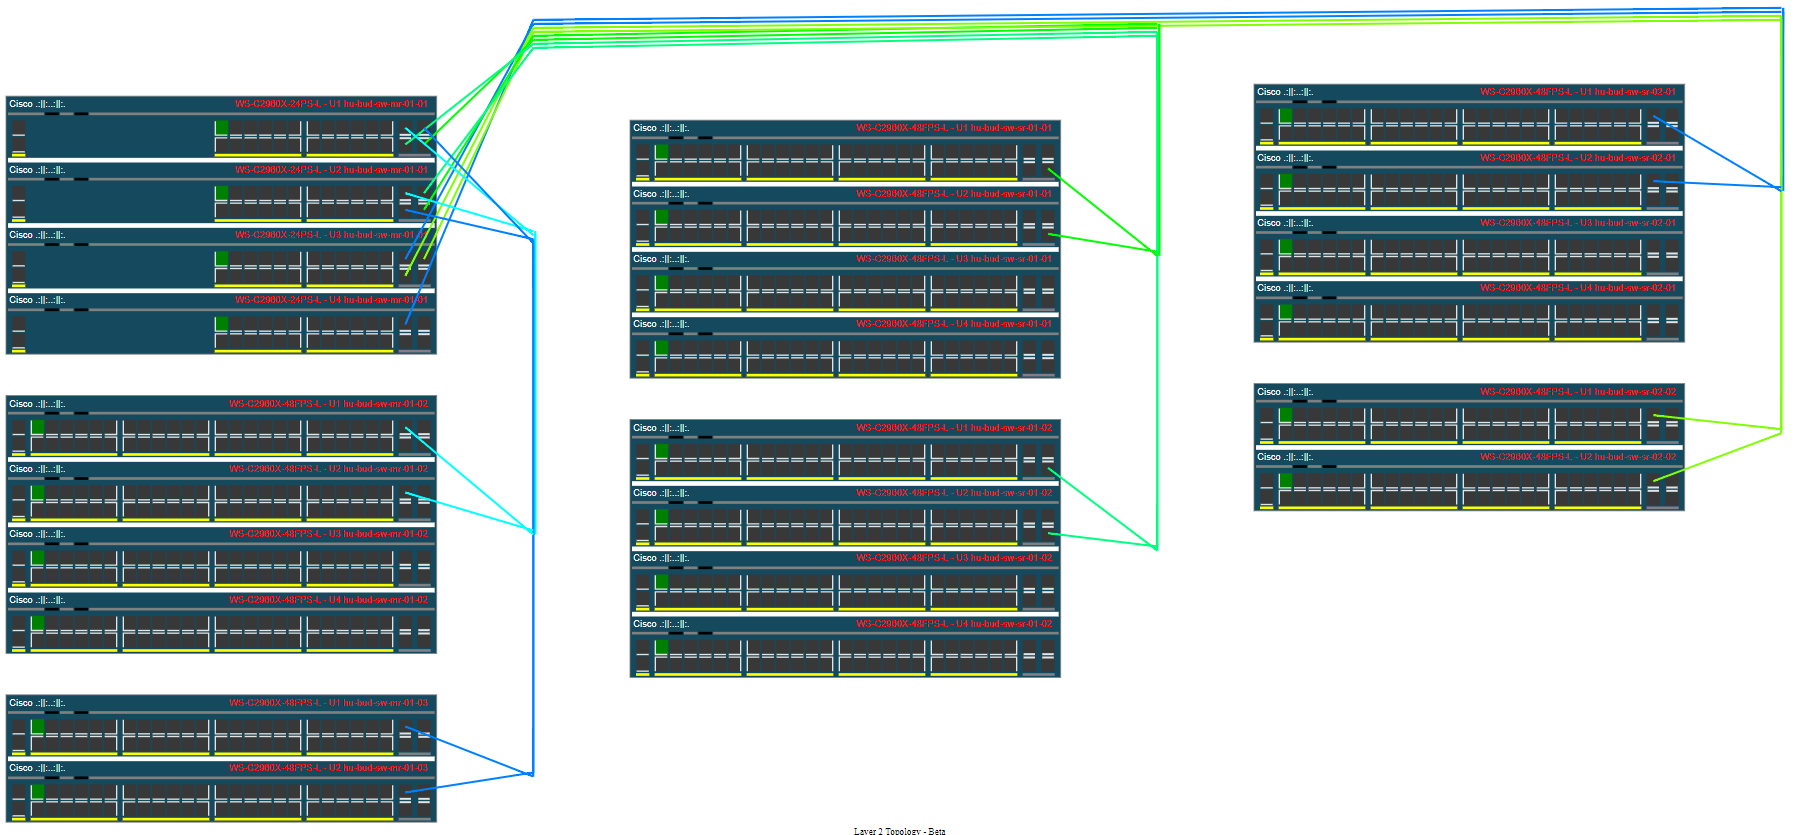
I mentioned a code for demonstration purposes that can create leaf L2 network (currently supports only stacking and port channel setups). This code is not for login into the devices and collect all the cdp or lldp data. This is for educational purposes,where the topology can be defined in a json file. with some scripting it is possible to create this json input with data collection from switches via ssh. The python script is here:
https://github.com/itsecworks/network_graphing/blob/main/leaf_viewer/L2_topo.py
It has the following input file:
https://github.com/itsecworks/network_graphing/blob/main/leaf_viewer/L2_topo_input_sw_24p.json
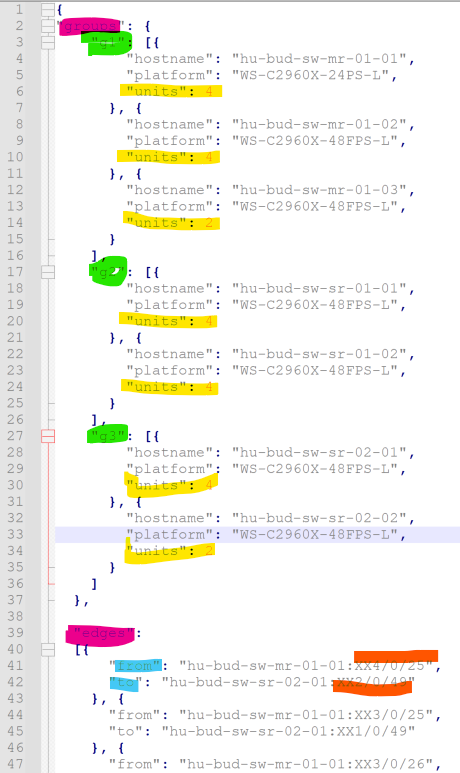
this needs an input json file that defines groups and switches in the group and the connections between the switsches (the uplinks and downlinks in port channel for example).
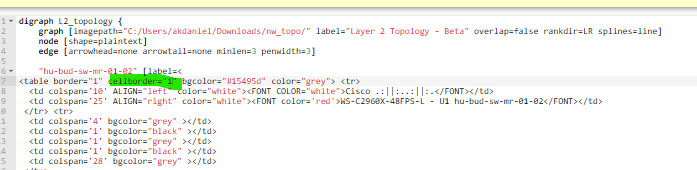
A group (green marked) is like a rack, you can group the switches that are in the same rack and you can set the order of the switches as you create the group elements (switches) in json.
The units (yellow marked) represents the units used in stack. If the switch is not in stack use 1.
For the edges we set the source switch and destination switch and the ports that connects the switches (blue and orange marked) the from and the to keys in json.
This script is to represent a leaf of the network, that means it is not for creating layer3 topologies. That one is a different story, but still possible with python and graphviz…
And now the life of the network on layer2 presented by me :-P

Posted on November 22, 2023
0