In the middle of 2021 I worked for the first time with SASE Service from Palo Alto and at that time there was no ADEM (Autonomous Digital Experience Management or Monitoring) so I had to invent something on my own for the same purpose.
That was the first time I started to work with Microsoft Powershell since the majority of the VPN clients are windows clients and for data collection this is the right scripting language out of the box.
So the monitoring itself was pretty simple since it’s the same as for the other kinds of infrastructure elements (firewalls , routers, switches ).
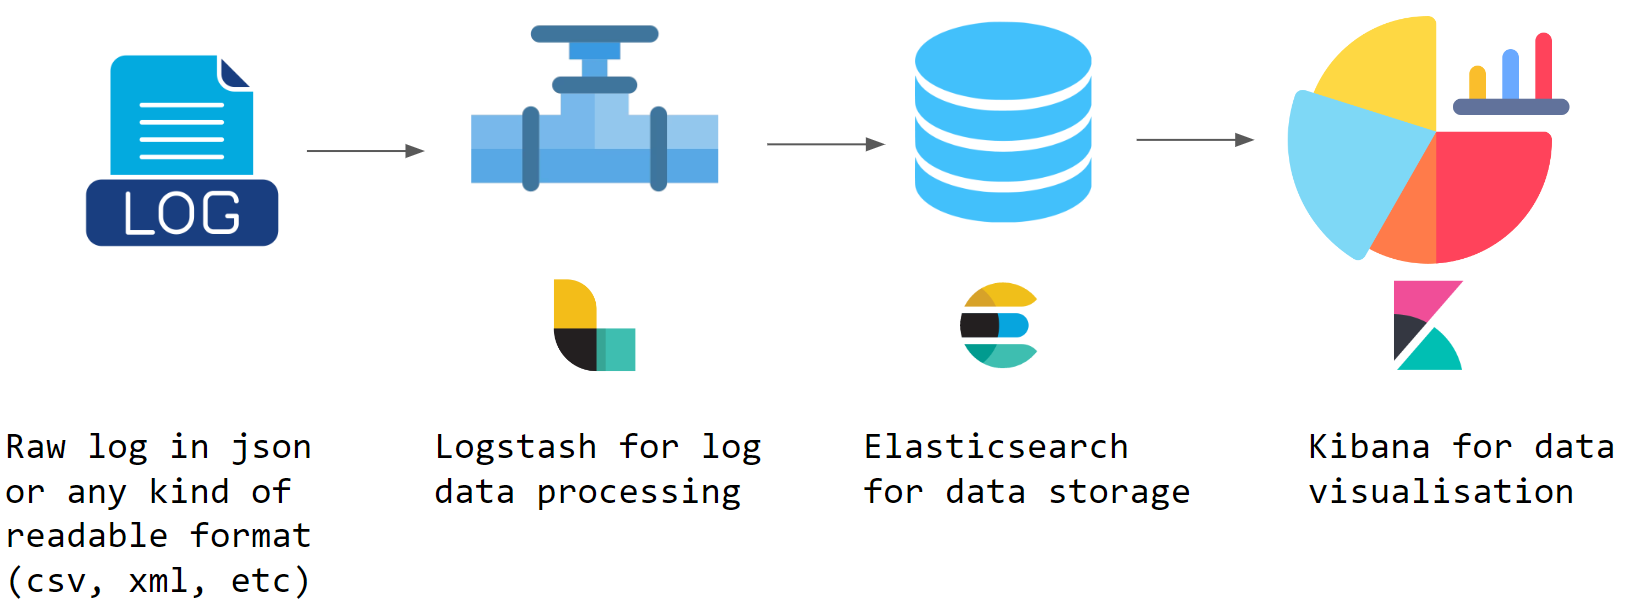
I work with ELK Stack for large amount of log analysis and with measurements that have dynamic field counts or field names.
and I work with TIG Stack for standard monitoring purposes (inclusive threshold settings and alerting and automated state collection)

The monitoring part is given, what we need is a collector the creates the log data if the device itself is not able to generate that. We can use powershell to collect data and it can be anything that is out of your fantasy. I started in 2021 with ping only and in the last 3 months I extended it with some other data like:
- dns resolution time
- cpu, memory usage
- ip, tcp, udp counters from the netsh command
- wifi strength
- ping via icmp or tcp with destination port
- TODO: web request measurements, authentication login time measurement

For ping I use psping from sysinternals also from Microsoft. This utility can do the 3 way handshake to the given destinaion port or it can simple use icmp. With powershell we can set unlimited number of host for RTT ( round trip time ) measurements via psping.
Considering the PRISMA SASE architecture we can ping over the different pathes the are available from the mobile user client, like remote sites, DCs, HQ and different internet apps.
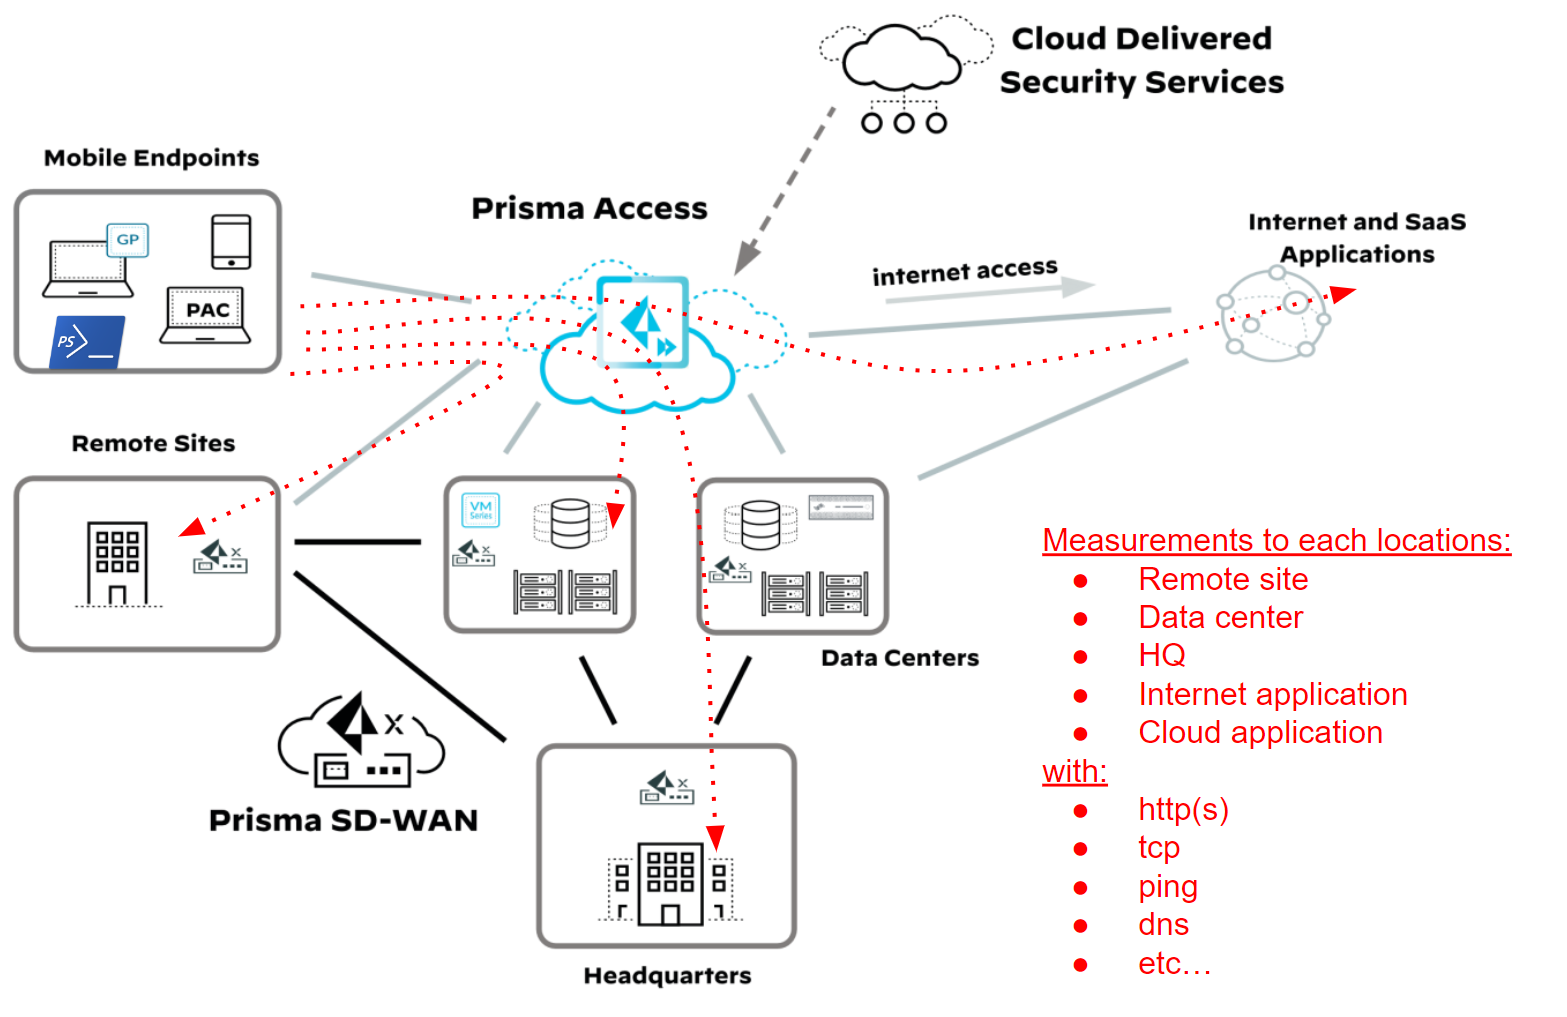
So we can measure a lot of stuff and this could be defined based on the use case. This list on the picture can be easily extended, since with powershell you can query everything on the windows device.
Once the data is given like wifi strength or round trip time to an internal server we have to extend this with informations like:
- VPN client IP Address
- VPN gateway IP Address
- Domain Name of the user
- Username
- Device hostname (on TODO List)
- Timestamp (very important!)
Each of the list item can be queried easily.
To get VPN client IP Address in case of Global Protect:
# Get the GlobalProtect allocated IP with ServiceName PanGpd:
$gp_ipaddrs = Get-WmiObject Win32_NetworkAdapterConfiguration -Filter IPEnabled=True | where {$_.ServiceName -eq 'PanGpd'} | Select-Object -Property IPAddress
# Its an array of 2 IPs in Windows, the 1st one is IPv4 and the 2nd one is IPV6.
if ([bool]$gp_ipaddrs.IPAddress) {
    [string]$GPIPv4Address = $gp_ipaddrs.IPAddress[0]
}
else {
    [string]$GPIPv4Address = "0.0.0.0"
}
or to simple get the timestamp that will be added to the measurement point:
get date for timestamp
$TimeStamp = (get-date).ToString("yyyy-MM-dd HH:mm:ss")
or the get the wifi signal from the client, its pretty simple:
$value = (netsh wlan show interfaces) -Match '^\s+Signal' -Replace '^\s+Signal\s+:\s+','' -Replace '%','' | Out-String
$value = $value.Trim()
Once we have the extended data we can save it to a file locally and since the vpn client connected we can save it in a shared folder that logstash or telegraf uses as a file input.
If for some reason the client cannot access the shared folder it caches the log data and holds it till the shared folder is available again. This part is scripted and is very simple.
once logstash or telegraf has the data they write it to their database and we can Visualize it easily with Kibana or Grafana.
Here are a detailed but short pdf and video about the basic functionality of the vpn client monitoring service (in the video the AWS Amazon Polly, the AI driven speech service talks, my voice is not so beautiful :-) ):
And here are the scripts I used on windows:
Link for the powershell scripts….comes soon…
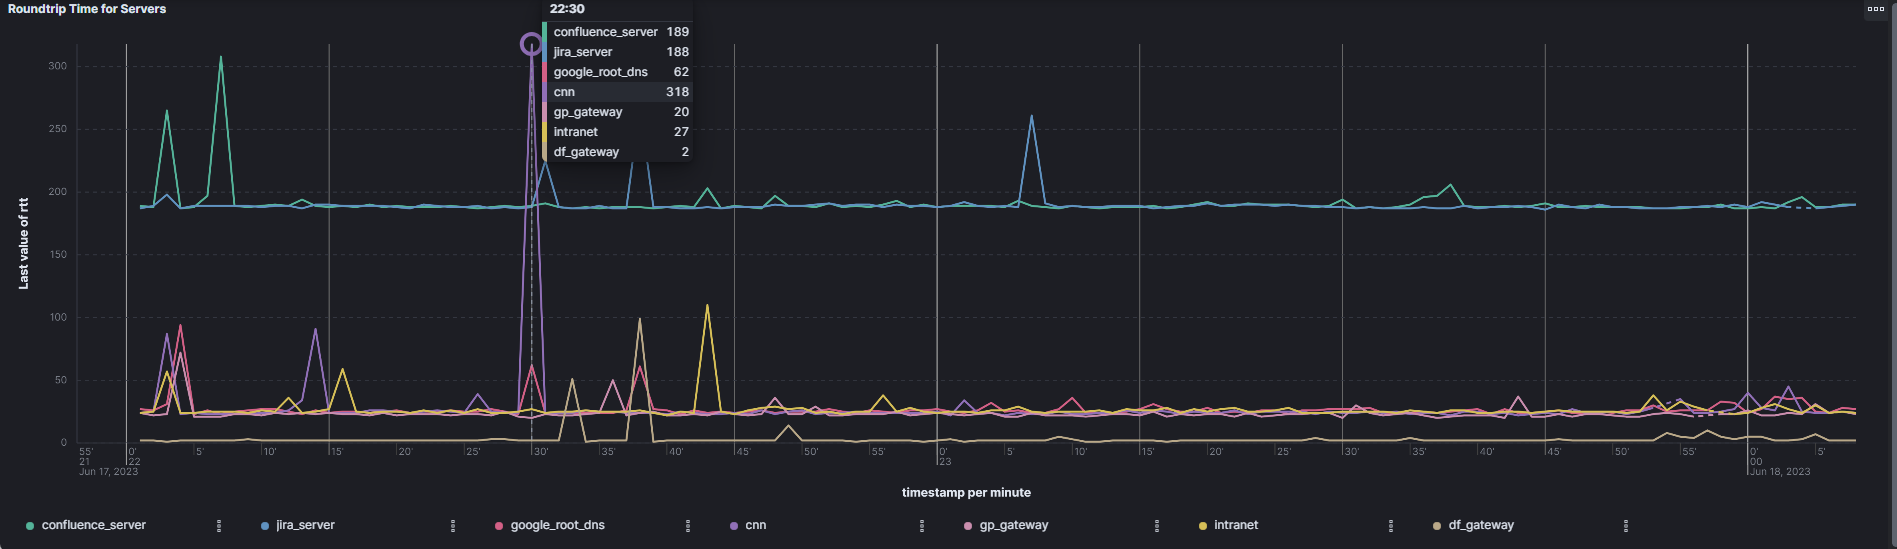
If all done the dashboard has been built (thats pretty simple in Kibana or in Grafana) this is one possible result that can be used for supporting client cases, bad experiences.
You can filter on username or within a domain for a username. This can be easily extended with device hostname, but I created it for presentation purposes…

Here are the RTT values represented in Kibana. You can see that the internal servers are way slower in response time then an internet server like the webserver from cnn.com (remember all those hosts are customizable, and some of them are dynamic, like the vpn gateway IP and the default gateway of the vpn client. They should not be set, since the script collects them dynamically):
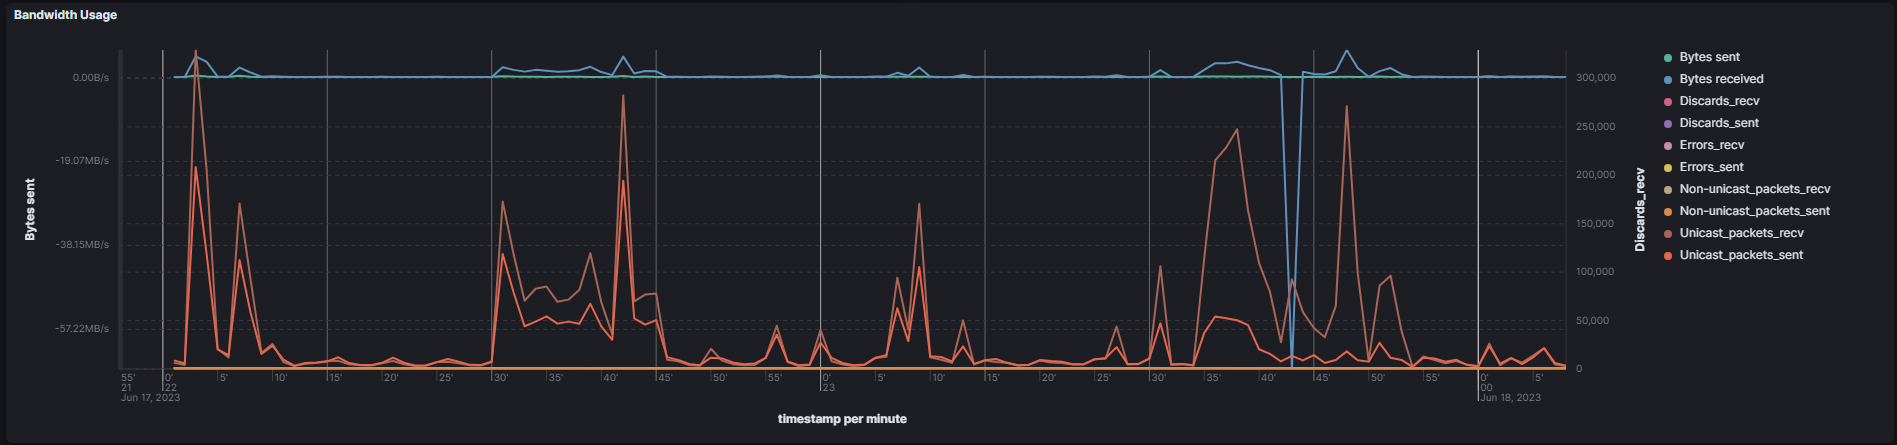
and the different counters for ip, tcp, and udp, that has been collected with netsh or netstat commands. Here is the complete list I used for demonstration purposes:
- netsh interface ipv4 show ipstats
- netsh interface ipv4 show tcpstats
- netsh interface ipv4 show udpstats (on TODO List)
- netstat -e


The real advantage of this solution is, that its easy to deploy and the components are free to use so there are no limitations like other vendors have and if you need a new feature, you have an idea how to extend it, you dont have to wait years till the product management from the vendor takes your request in productive release.
Regarding sharing the PS scripts to remote users and start them after the boot time of the end device from the users is your home work, but it is again a simple step…


Posted on July 4, 2023
0